the HFT liquidity provider paradox
30/04/2017

On this example, we could notice a very good situation. Indeed, the price is stopping to go down, and start to be sideways (in range). Suddenly, you could see 4 big green point which are triggered, and appears on the quantmap with the text label "Bid Iceberg".
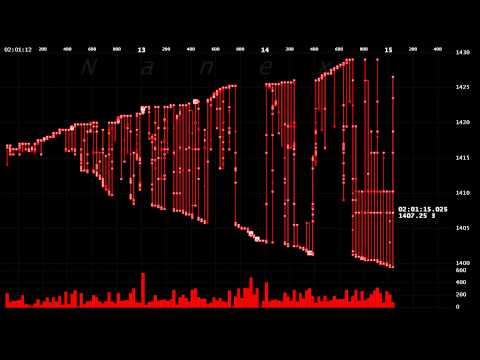
One of the scariest high frequency trading algos ran in the electronic S&P 500 futures (eMini) contract on January 14, 2008 starting at 2:01:11Eastern. During its 7 second reign, there were over 7,000 trades (52,000 contracts), and the price eventually oscillated within milliseconds, the equivalent of about 400 points in the Dow Jones Industrial...
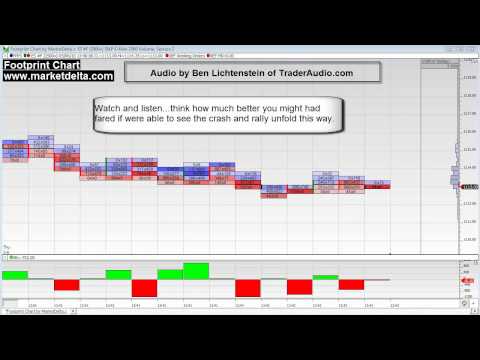
This shows the market crash on May 6th using the MarketDelta Footprint chart and TradersAudio.com broadcast from the S&P 500 pit on the trading floor. Careful, it will get your adrenaline pumping!